示例
一、安装
npm install --save echarts-for-react
//如果需要使用echarts的一些特殊方法需要安装
npm install --save echarts
二、使用
import ReactEcharts from 'echarts-for-react';
import echarts from 'echarts';

<ReactEcharts
    option={this.getOption()}
    notMerge={true}
    lazyUpdate={true}
    onEvents={onEvents}
    style={{width: '100%',height:'100%'}}
/>
三、echarts API
1、设置区域颜色渐进
echarts.graphic.LinearGradient
{
    value : [10, 250, 100, 370, 80, 500, 190, 400],
    // 设置区域边框和区域的颜色
    itemStyle: {
        normal: {
            //雷达图区域颜色
            color: new echarts.graphic.LinearGradient(0, 0, 0, 1, [{
                offset: 0.5,
                color: 'rgba(139,241, 134, 0.7)'
            },
            {
                offset: 1,
                color: 'rgba(0,208, 131, 1)'
            }]),
            opacity:0,
            lineStyle: {
                width: 0,
                color: '#8BF186',
            },
        },
    },
    name : '昨日更新投诉量'
}
2、legend标签配置
legend: {
    //图例文字展示
    data: [
        { name:'今日更新投诉量' },
        { name:'昨日更新投诉量' }],
    //图例显示在底部
    bottom:0,
    //图例背景颜色
    backgroundColor:"transparent",
    // 图例标记的图形宽度。[ default: 25 ]
    itemWidth:12,
    // 图例标记的图形高度。[ default: 14 ]
    itemHeight:9,
    //图例文字样式设置
    textStyle:{
        color:"#333",                //文字颜色
        fontStyle:"normal",         //italic斜体  oblique倾斜
        fontWeight:"normal",        //文字粗细bold bolder lighter  100 | 200 | 300 | 400...
        // fontFamily:"sans-serif",   //字体系列
        fontSize:12,                //字体大小
    }
}
3、极坐标区域大小控制
radius:'65%',4、极坐标指示器配置
formatter动态拼接指示器名称
//雷达指示器参数配置
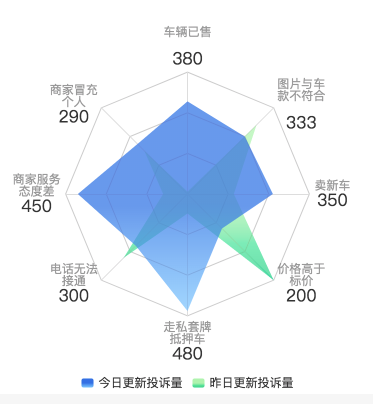
indicator:[
{"name":"车辆已售","value":380,"max":500},
{"name":"商家冒充个人","value":290,"max":500},
{"name":"商家服务态度差","value":450,"max":500},
{"name":"电话无法接通","value":300,"max":500},
{"name":"走私套牌抵押车","value":480,"max":500},
{"name":"价格高于标价","value":200,"max":500},
{"name":"卖新车","value":350,"max":500},
{"name":"图片与车款不符合","value":333,"max":500}
]
name: {
textStyle: {
color: '#999',
backgroundColor: 'transparent'
// borderRadius: 3,
// padding: [3, 5]
},
formatter:function(value,indicator){
//指示器名称过长截取
value = value.replace(/\S{4}/g, function(match) {
return match + '\n'
})
// value = value + '\n' + indicator.value;
return '{a|'+value+'}'+ '\n' + '{b|'+indicator.value+'}'
},
//富文本编辑 修改文字展示样式
rich:{
a:{
color:"#999",
fontSize:12,
align: "center"
},
b:{
color:"#333",
fontSize:17,
align: "center"
}
}
}
formatter回调参数:
value:返回indicator指示器的name值 如:车辆已售
indicator: 返回雷达指示器的所有参数 如:{"name":"车辆已售","value":380,"max":500}
rich定义富文本样式
可区分引用rich里面定义的样式 如上5、点击事件绑定
click事件
onChartClick(param,echarts){
    console.log(param)
}
render(){
    let onEvents={
        'click': this.onChartClick.bind(this)
    }
    return(
        <div className="echartsRadar">
            <ReactEcharts
                option={this.getOption()}
                notMerge={true}
                lazyUpdate={true}
                onEvents={onEvents}
                style={{width: '100%',height:'100%'}}
            />
        </div>
    )
}
返回参数
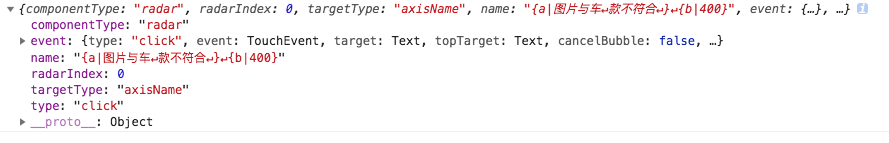
param返回当前点击的所有参数信息
点击雷达图区域:
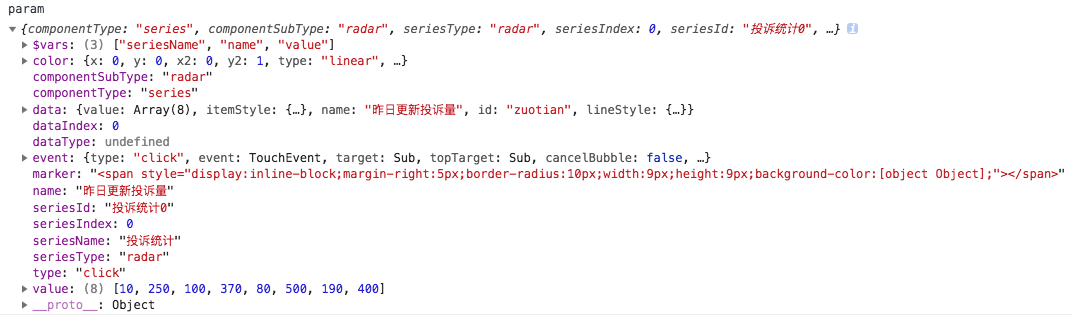
点击指示器显示部分
legend标签点击事件
onChartLegendselectchanged(param,echarts){
    console.log(param)
}
render(){
    let onEvents={
        'legendselectchanged': this.onChartLegendselectchanged.bind(this)
    }
    return(
        <div className="echartsRadar">
            <ReactEcharts
                option={this.getOption()}
                notMerge={true}
                lazyUpdate={true}
                onEvents={onEvents}
                style={{width: '100%',height:'100%'}}
            />
        </div>
    )
}
回调参数:
param:
{
    "name":"今日更新投诉量",
    "selected":{
        "今日更新投诉量":false,
        "昨日更新投诉量":true
    },
    "type":
    "legendselectchanged"
}
完整代码
import React, { Component } from 'react';
import '../scss/echartsRadar.scss';//引入组件依赖样式
// 引入 ECharts 主模块
import echarts from 'echarts/lib/echarts';
// 引入雷达图
// import  'echarts/lib/chart/radar';
// 引入提示框和标题组件
// import 'echarts/lib/component/tooltip';
//引入title
// import 'echarts/lib/component/title';
//引入图例
// import 'echarts/lib/component/legend';
import ReactEcharts from 'echarts-for-react';
const mytextStyle={
    color:"#333",                //文字颜色
    fontStyle:"normal",         //italic斜体  oblique倾斜
    fontWeight:"normal",        //文字粗细bold   bolder   lighter  100 | 200 | 300 | 400...
    // fontFamily:"sans-serif",   //字体系列
    fontSize:12,                //字体大小
};
export default class EchartsRadar extends Component {
    constructor(props){
        super(props);
        this.state={

        };
        // this.indicator = []
    }


    /**
     * @description 配置图表
     * @returns
     * @memberof EchartsRadar
     */
    getOption(){
         return {
            title: {
                text: ''
            },
            //点击提示标签
            // tooltip: {},
            legend: {
                //图例文字展示
                data: [
                    { name:'今日更新投诉量' },
                    { name:'昨日更新投诉量' }],
                //图例显示在底部
                bottom:0,
                //图例背景颜色
                backgroundColor:"transparent",
                // 图例标记的图形宽度。[ default: 25 ]
                itemWidth:12,
                // 图例标记的图形高度。[ default: 14 ]
                itemHeight:9,
                //图例文字样式设置
                textStyle:mytextStyle
            },
            radar: {
                //雷达图绘制类型,支持 'polygon' 和 'circle' [ default: 'polygon' ]
                shape: 'polygon',
                splitNumber: 3,
                center:['50%','50%'],
                radius:'65%',
                //指示器名称和指示器轴的距离。[ default: 15 ]
                nameGap:5,
                triggerEvent:true,
                name: {
                    textStyle: {
                        color: '#999',
                        backgroundColor: 'transparent'
                        // borderRadius: 3,
                        // padding: [3, 5]
                   },
                   formatter:function(value,indicator){
                        value = value.replace(/\S{4}/g, function(match) {
                            return match + '\n'
                        })
                        // value = value + '\n' + indicator.value;
                        return '{a|'+value+'}'+ '\n' + '{b|'+indicator.value+'}'
                    },
                    //富文本编辑 修改文字展示样式
                    rich:{
                        a:{
                            color:"#999",
                            fontSize:12,
                            align: "center"

                        },
                        b:{
                            color:"#333",
                            fontSize:17,
                            align: "center"
                        }
                    }
                },
                // 设置雷达图中间射线的颜色
                axisLine: {
                    lineStyle: {
                        color: '#ddd',
                    },
                },
                indicator: [
                    {"name":"车辆已售","value":380,"max":500},
                    {"name":"商家冒充个人","value":290,"max":500},
                    {"name":"商家服务态度差","value":450,"max":500},
                    {"name":"电话无法接通","value":300,"max":500},
                    {"name":"走私套牌抵押车","value":480,"max":500},
                    {"name":"价格高于标价","value":200,"max":500},
                    {"name":"卖新车","value":350,"max":500},
                    {"name":"图片与车款不符合","value":333,"max":500}
                ],
                //雷达图背景的颜色,在这儿随便设置了一个颜色,完全不透明度为0,就实现了透明背景
                splitArea : {
                    show : false,
                    areaStyle : {
                        color: 'rgba(255,0,0,0)', // 图表背景的颜色
                    },
                }
            },
            series: [{
                name: '投诉统计',
                type: 'radar',
                //显示雷达图选中背景
                areaStyle: {normal: {}},
                data: [
                    {
                        value : [380, 290, 450, 300, 480, 200, 350, 333],
                        // 设置区域边框和区域的颜色
                        itemStyle: {
                            normal: {
                                //雷达图背景渐变设置
                                color: new echarts.graphic.LinearGradient(0, 0, 0, 1, [{
                                    offset: 0.5,
                                    color: 'rgba(48,107, 231, 1)'
                                },
                                {
                                    offset: 1,
                                    color: 'rgba(73,168, 255, 0.7)'
                                }]),
                                //去除刻度
                                opacity:0,
                                //雷达图边线样式
                                lineStyle: {
                                    width: 0,
                                    color: '#306BE7',
                                },
                            },
                        },
                        name : '今日更新投诉量',
                        id: "jintian"
                    },
                    {
                        value : [10, 250, 100, 370, 80, 500, 190, 400],
                        // 设置区域边框和区域的颜色
                        itemStyle: {
                            normal: {
                                color: new echarts.graphic.LinearGradient(0, 0, 0, 1, [{
                                    offset: 0.5,
                                    color: 'rgba(139,241, 134, 0.7)'
                                },
                                {
                                    offset: 1,
                                    color: 'rgba(0,208, 131, 1)'
                                }]),
                                opacity:0,
                                lineStyle: {
                                    width: 0,
                                    color: '#8BF186',
                                },
                            },
                        },
                        name : '昨日更新投诉量',
                        id: "zuotian"
                    }
                ]
            }]
        };
    }
    /**
     * @description 雷达图选中区域点击事件和外部显示标签点击事件
     * @param {any} param
     * @param {any} echarts
     * @memberof EchartsRadar
     */
    onChartClick(param,echarts){
        console.log(param)
    }
    /**
     * @description 点击legend事件
     * @param {any} param
     * @param {any} echarts
     * @memberof EchartsRadar
     */
    onChartLegendselectchanged(param,echarts){
        console.log(param)
    }
    componentWillReceiveProps(nextProps){
    }
    componentWillMount(){
    }
    componentDidMount(){
    }
    render(){
        let onEvents={
            'click': this.onChartClick.bind(this),
            'legendselectchanged': this.onChartLegendselectchanged.bind(this)
        }
        return(
            <div className="echartsRadar">
                <ReactEcharts
                    option={this.getOption()}
                    notMerge={true}
                    lazyUpdate={true}
                    onEvents={onEvents}
                    style={{width: '100%',height:'100%'}}
                />
            </div>
        )
    }
}
依赖样式echartsRadar.scss:
.echartsRadar{
    display: flex;
    // align-items: center;
    justify-content: center;
    height: 400px;
}
.echartsPie{
    display: flex;
    justify-content: center;
    height: 280px;
}